Garmin Relief Shading: Reading Underwater Terrain on a Chart
A practical guide to interpreting shaded underwater terrain on compatible Garmin charts, checking data limits, and turning map detail into cautious fishing and boating decisions.
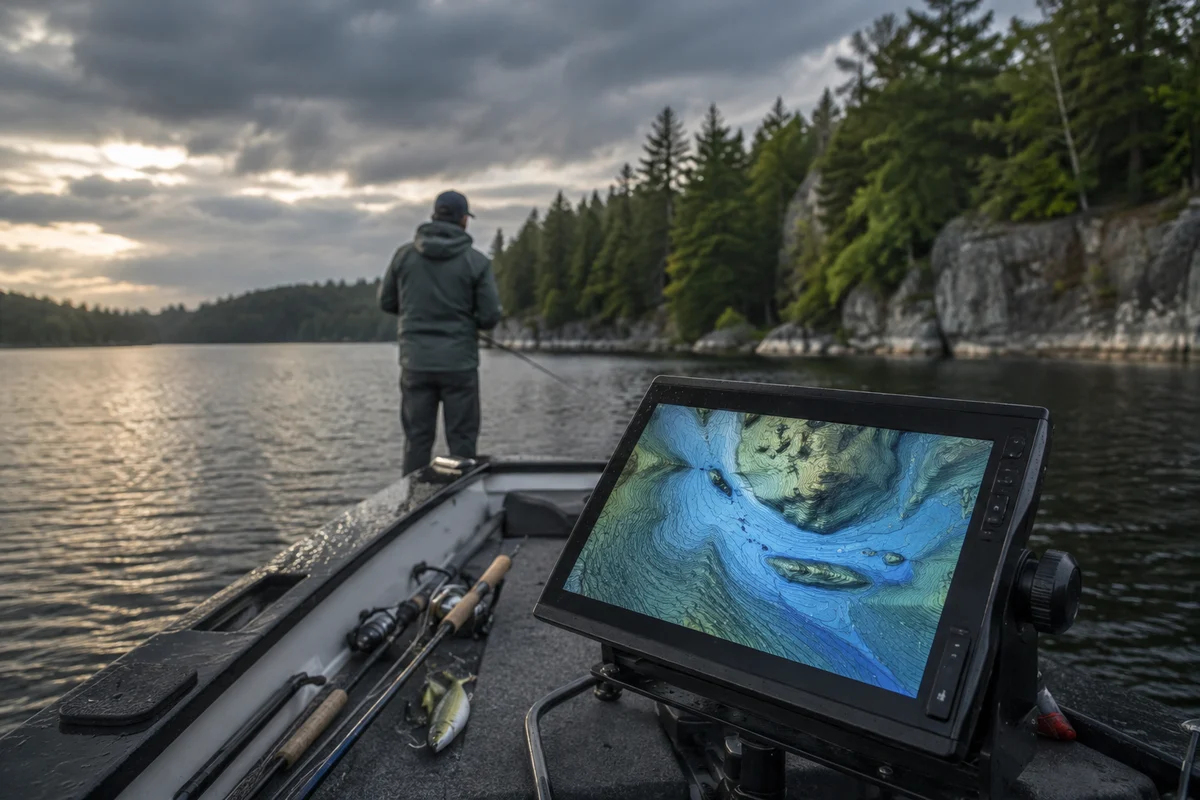
Garmin relief shading can make underwater terrain easier to interpret by giving depth changes a more dimensional appearance on a compatible chartplotter. It can help anglers notice contour edges, humps, channels, and transitions that are less obvious in simple contour lines. But shaded relief is a visualization of chart data, not a live sonar reading or a guarantee that every bottom feature is mapped accurately. Before relying on it, check that your chart product and device support the view, understand what the underlying data represents, and confirm important features on the water.
What does relief shading show?
Relief shading uses variations in color and light-dark contrast to suggest changes in underwater elevation. A steep drop may appear as a stronger transition; a broad, gradual slope may look smoother. The effect can make a contour map quicker to scan, especially when you are comparing a shoreline shelf, a basin edge, or a submerged point.
The shading does not create new measurements. It presents bathymetric information that has already been collected and processed. The quality and detail therefore depend on the chart coverage and source data for that location. Some areas may have dense survey information, while others rely on less detailed or older sources. A crisp-looking image can still represent generalized data.
Is Garmin relief shading available on every chartplotter?
No. Availability depends on the specific Garmin chart product, device, software, and coverage. Product families and chart editions change, so check the current Garmin documentation for your unit and the chart package you use rather than assuming a feature shown in an example will appear on every screen.
Before a trip, confirm the chart is installed and updated as appropriate, then look for relief or shaded-relief display controls in the chart settings. If the menu wording differs, use the manual for your exact model. Keep a conventional chart view available as a comparison: contour lines, depth labels, and navigation marks remain important even when shaded terrain is enabled.
How can anglers read the shaded bottom?
Start with broad shapes, not tiny color changes. Identify the general basin, shoreline slope, and likely transitions. Then compare those shapes with contour lines and soundings. A narrow contour interval and a visible edge can suggest a more abrupt slope, while widely spaced contours tend to indicate gentler change; chart scale and source quality still matter.
For fishing, treat features as hypotheses to investigate. A point extending into deeper water, a channel bend, or a break between shallow and deep areas may be worth checking against seasonal conditions and local regulations. Relief shading does not show whether fish are present, what depth they occupy today, or whether a spot is legally accessible. Wind, temperature, vegetation, water level, forage, and fishing pressure all influence results.
A useful routine is to mark a few candidate areas before launching, then use your sounder and observations to refine the picture. If the display and sonar disagree, slow down and consider chart age, water level, transducer setup, and position accuracy. Do not interpret a mismatch as proof that either instrument is always right.
What are the main limits of shaded bathymetry?
The view can encourage false precision. Shading may make a broad slope look like a sharp ledge, or visually emphasize a small feature that is not represented with enough survey detail to navigate around confidently. Charted depths can differ from current conditions because of water-level changes, sediment movement, dredging, or other changes in the environment.
Use the chart as one source of information, not as a substitute for navigation judgment. Follow marked channels and applicable navigation rules, maintain a safe speed for visibility and conditions, and keep attention on hazards beyond the display. In unfamiliar water, consult current official charts and local notices where relevant. Leave room for uncertainty around shoals, rocks, submerged structures, and narrow passages.
How should you compare relief shading with sonar?
Chart shading gives a mapped overview; sonar provides readings from the vessel’s present location and depends on equipment setup and conditions. They answer related but different questions. The chart can help plan a route or identify a broad area to explore. Sonar can help check depth and structure beneath or near the boat as you move.
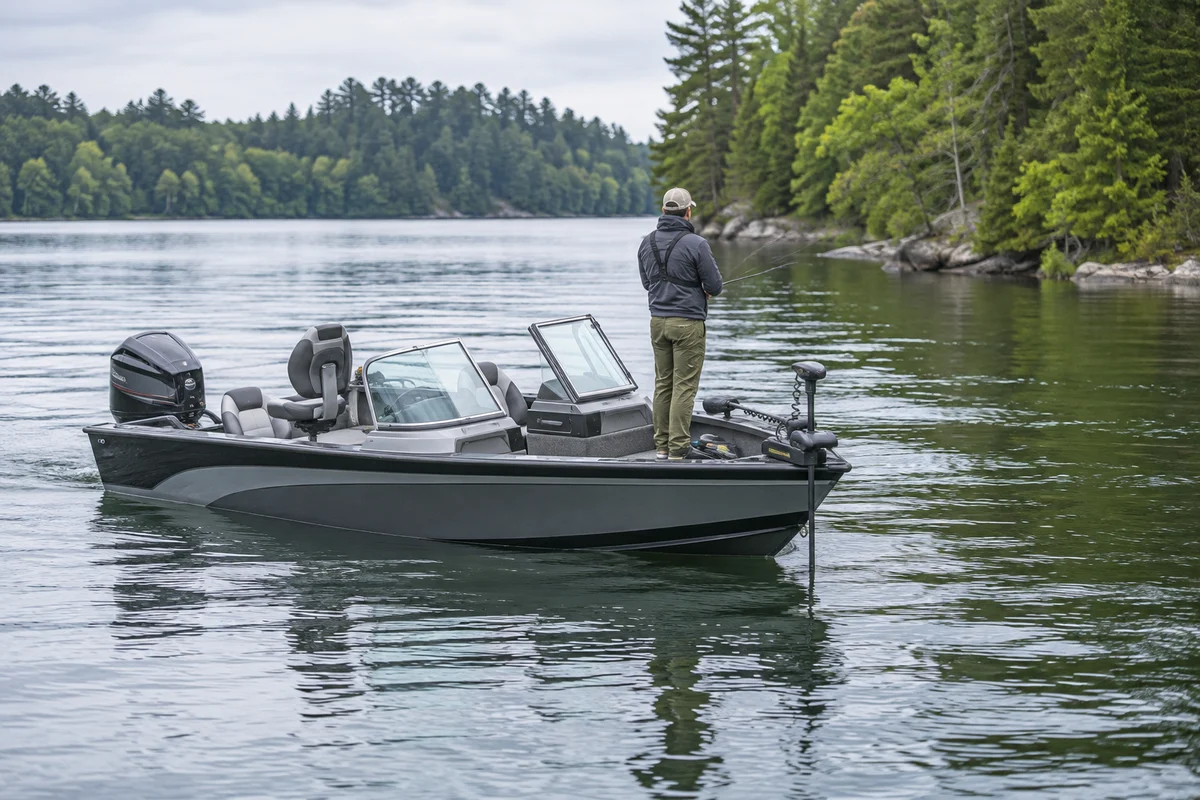
When comparing them, first verify that the chartplotter position and sonar depth reading are plausible. Check the transducer installation and settings described by the manufacturer. Then make a cautious pass over a feature only where conditions and navigation allow. Record useful waypoints with clear notes, but avoid treating one pass as a complete survey. For boat selection and setup context, see our coverage of Recon boats and the Lund 1850 Impact XS; those topics can help frame the boat and electronics questions to ask, not establish a chart’s accuracy.
What should you check before leaving the dock?
Confirm that the chartplotter has reliable power, the correct chart area is available, and the display is readable in the conditions you expect. Set a useful scale: zooming too far out can hide details, while excessive zoom can imply detail the data does not contain. Review routes and hazards before departure rather than making unfamiliar decisions while underway.
Carry the navigation resources appropriate to your trip and know how to use them if electronics fail. Tell someone your plan when traveling remotely, monitor weather, and adjust or cancel the trip when conditions exceed your ability or equipment. A detailed map does not make rough water, low visibility, or an unfamiliar channel safe.
For more boat and on-water reporting, browse more outdoor coverage. If you are planning a small-craft fishing trip, our guide to kayak fishing tips for catching more fish offers a separate look at preparation and fishing approach.
A practical way to use the feature
Use relief shading to form a question, then verify it. Notice a potential drop-off, compare it with contours and soundings, consider the chart’s scale and coverage, and use safe observation or sonar to check what is actually there. Keep records of what you learn without assuming the same pattern will hold at another water level or season.
The feature is most useful when it improves orientation and helps you ask better questions about underwater terrain. Its value is not in replacing a sounder, current navigation information, or local expertise, but in making chart data easier to read while leaving room for uncertainty.
Frequently asked questions
Does relief shading show live depth?
No. It visualizes mapped bathymetric data. A chartplotter’s sonar may provide current depth readings, but those readings depend on equipment, settings, position, and conditions.
Can shaded relief identify a fishing spot by itself?
No. It may help you identify terrain worth investigating, but it cannot confirm fish presence or current feeding activity. Combine chart interpretation with conditions, legal access, and on-water observations.
Why might the chart look different from the bottom reading?
The chart and sonar may use different data sources and represent different moments or locations. Chart detail, water-level changes, position error, transducer setup, and display scale can all contribute to differences. Treat unexpected readings cautiously and verify before navigating near a hazard.
Sources & further information
Consult these primary sources for current regulations, technical information and local guidance.